

Based on a paper presented at the Sonochemistry Symposium, Annual Chemical Congress, held at Warwick University, UK.
By J P Perkins
Sonic Systems Ltd, Bakers Farm Barns, Puckington, Ilminster, Somerset TA19 9JA UK
With chemists turning more and more to ultrasound as a source of energy for the acceleration or modification of chemical reactivity, so it becomes increasingly important that they understand some of the ultrasonic engineering principles which underpin the whole topic of sonochemistry. This article is intended to provide an introduction to the principles of generation of ultrasound for the non-specialist. It is to be hoped that a chemist, armed with this information, will be in a much better position to decide on the type of equipment most appropriate for the intended laboratory application.
The majority of chemists who have an interest in sonochemistry will naturally have acquired some familiarity with the types of ultrasonic equipment used for their work. However, with the increased usage of ultrasound in chemistry, as evidenced by the large number of sonochemical papers currently being published in the literature, more chemists are seeking information on the choice of equipment available and those already in the field may well be looking for more refined instrumentation. As part of any refinement one would expect a move towards some means of monitoring acoustic performance.
The purpose of this article is to explore some of the principles behind the generation of power ultrasound. In doing so it is hoped that a practising chemist may gain not only a better knowledge of these fundamentals but also an appreciation of some of the parameters which ought to be monitored when applying acoustic energy in fundamental sonochemical studies.
There are two basic methods of applying acoustic power to liquid loads (see Figure 1).
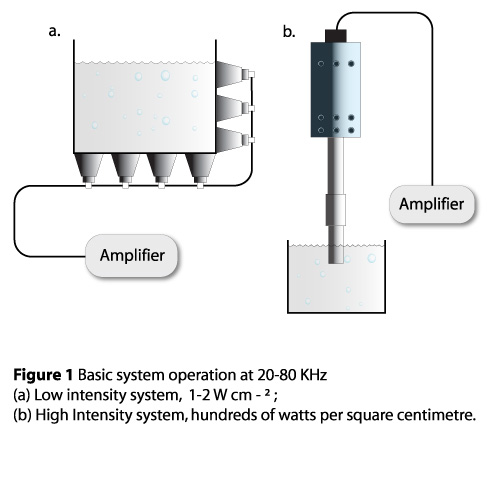
One is a low intensity system; essentially an ultrasonic cleaning bath in which a liquid filled tank has multiple transducers bonded around the base and walls. The other is a single transducer, which couples energy into a chemical reaction by means of a horn or velocity transformer. The latter will be referred to as a probe system. Each transducer arrangement is powered by a generator or power amplifier.
One of the basic parameters in ultrasonic engineering is power density which can be defined as the electrical power into the transducer divided by the horn radiating surface area. The low intensity (bath) system uses a power density at the transducer face of the order 1-2 W cm-2 for a modern piezoelectric transducer. It is normal, therefore, to employ a number of transducers to put high powers into liquids contained in such tanks. For the probe system we can achieve a much greater maximum power density at the radiating face of the horn. This can be of the order of several hundred W cm-2. In both of these cases the working frequencies are of the order 20-40 kHz. Both types of systems have merit but for research purposes the probe system seems to offer the following advantages:
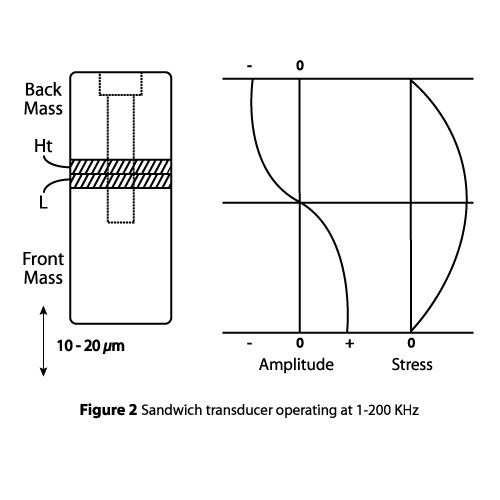
Transducers used in modern power ultrasonic systems are almost without exception based upon the pre-stressed piezoelectric design. In this construction, a number of piezoelectric elements - normally two or four - are bolted between a pair of metal end masses. The piezo elements would be a pre-polarized lead titanate zirconate composition, which exhibit high activity coupled with both low loss and ageing characteristics. They are ideally suited to form the basis of an efficient and rugged transducer.
If we consider a length of polarized piezoelectric rod and drive this with an alternating Voltage, at a frequency corresponding to its resonant length, then this dimension will change in sympathy with the applied voltage. Such a rod would have a length of the order 70 mm at a frequency of 20 kHz. Its power handling capacity would be low since these ceramics have poor thermal capacity and low tensile strength. To overcome these inherent weaknesses a number of thin elements are clamped between two acoustically low loss metal end masses; either titanium or aluminium would be used for this purpose. The assembly would be designed so that the overall length was one half-wave at the required frequency of operation.
Figure 2 illustrates a typical transducer construction. Two piezo elements are positioned near to the point of maximum stress in a half-wave resonant assembly. Because the elements are pre-polarized they can be so arranged that they are mechanically aiding but electrically opposing. This feature enables both end masses to be at an earth potential. The assembly is clamped together by means of a high tensile bolt, which ensures the ceramics are in compression at maximum transducer displacement.
Transducers constructed in this way can have potential efficiencies of 98% and will handle power transfers of the order 500-1000 W when employed in a mode of continuous operation. Maximum peak to peak displacements at the transducer radiating face would be of the order 15-20 microns when operating at a frequency of 20 kHz.
For a detailed analysis of the pre-stressed piezoelectric transducer, the reader is directed to References 1 and 2.
The vibrating motion generated by the transducer is normally too low for practical use and so it is necessary to magnify or amplify this motion. This is the function of the horn which, like the transducer, is a resonant element in the compression mode. Normally, these are half a wavelength long, although, should the distance between the transducer and the sample being treated need to be increased, they can be designed in multiples of half wavelengths. This can also be achieved by screwing one horn into the other thereby building up the overall length.
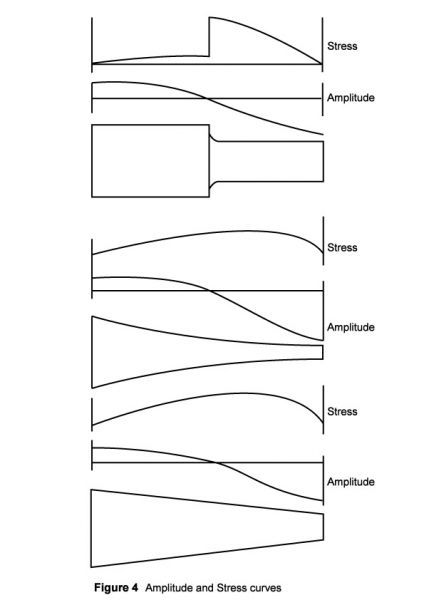
The most popular horn designs are shown in Figure 3.
Simple to make but its potential magnification is limited to a factor of approximately four-fold.
This design offers higher magnification factors than the linear taper. Its shape makes it more difficult to manufacture but its length coupled with a small diameter at the working end makes this design particularly suited to micro applications.
For this design the magnification factor is given by the ratio of the end areas. The potential magnification is limited only by the dynamic tensile strength of the horn material. This is a useful design and easy to manufacture. Gains of up to 16-fold are easily achieved in a practical horn.
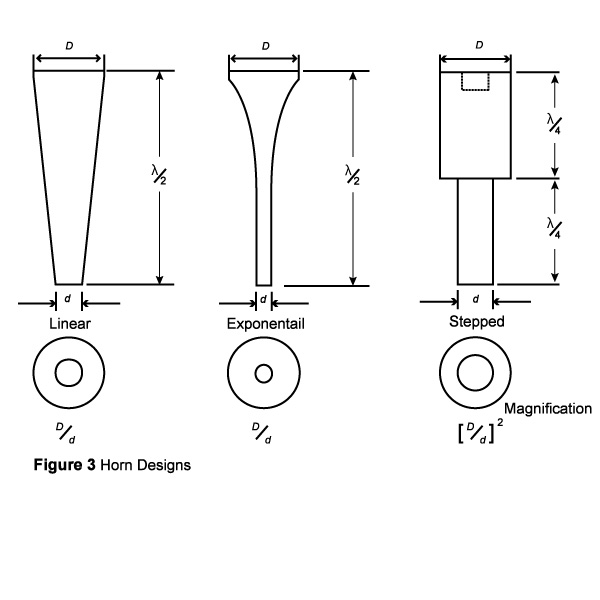
Magnification and stress distribution are shown for the three types (Figure 4). Note the stress discontinuity in the case of the stepped horn. Great care must be taken when machining these since any marks in the nodal region will create 'stress raisers' causing metal fatigue in high magnification horns.
When choosing a material for acoustic horns, then, we look for the following characteristics:
In order of preference, suitable materials which fit the above are:
Titanium alloys are way ahead of the other two in each of the four required characteristics. Aluminium alloys are too soft for the irradiation of liquids and, compared with titanium alloys, losses in aluminium bronze and stainless steel will result in end amplitudes reduced by factors of 0.75 and 0.5 respectively, assuming a given power going into the transducer. This is because the latter two materials are acoustically lossier and this will show up as heat, i.e. the horn will become hot and transfer heat to the reaction - an undesirable side effect.
In the industrial field, equipment is designed to undertake a particular application and vibrational levels are invariably predetermined. Nevertheless, these systems do contain some rudimentary monitoring. A meter indicating relative power supplied to the transducer is common but this does not normally indicate actual watts. One or two manufacturers do offer, in addition, a measurement of transducer amplitude. Industrially, this is quite adequate since either will indicate the consistency of machine performance. However, they are performing an industrial application and the final arbiter of this performance is the test or quality engineer whose responsibility it is to obtain a consistent final product.
In the research situation the end result is not necessarily known and therefore the performance of equipment cannot be judged by results. It would seem sensible therefore that a number of acoustic parameters should be monitored which would ensure:
There are two basic parameters which should be known, the operational frequency and the acoustic power in the treated sample. Frequency is not normally critical within 5-10% and so the nominal frequency of the system quoted by the manufacturer will probably suffice. Acoustic power is more difficult to measure because of the power by demand characteristics of most ultrasonic systems. This means that the rated power of the generator cannot be used as an indication of acoustic power, since the power transferred will depend upon: (a) how heavily the transducer is loaded (this is a function of horn magnification); and (b) the area of the horn immersed in the treatment sample.
There are three possible approaches to the determination of acoustic power:
This is simply the calculation of power input by measuring the rate of temperature rise in the system, taking into account its thermal capacity. It is a rather cumbersome method and to be used properly it should be undertaken each time a sample is treated, in case there are system variations. Thus, it is not really a practical method.
This is the direct measurement of the amplitude at the working face of the horn, and will give a parameter that is at least proportional to the acoustic power [Equation (1)].
Pac = ½ p.C.ς²
Where:
Pac = acoustic power
P= density of load
C = load sound velocity
ς = transducer amplitude
It does have the advantage that it can be continuously monitored but it cannot really be considered as an absolute method since r and c in a cavitating medium cannot easily be determined.
Amplitude measurement does offer a very sensitive measurement of acoustic change. It changes as the horn is immersed further into the treatment sample, i.e. as it becomes more loaded.
Additionally, it will give warning of any changes in acoustic transmission caused by:
A combination of the calorimetric method and measurement of vibrational amplitude might well be the most useful method of power monitoring and therefore control. In any event, by measuring amplitude we do have an indication of the acoustic power output rather than the electrical power into the transducer.
This can be converted to the acoustic power if the overall acoustic transfer efficiency is known. The use of a wattmeter to measure electrical power to the transducer can, in certain circumstances, lead to a measurement of the true acoustic power transmitted to the sonicated sample. This can certainly be true of probe systems used for sonochemical treatment. If the system is driven in a controlled manner then we can derive the transmitted acoustic power from the unloaded and loaded electrical powers.
The acoustic power transmitted by a transducer/horn arrangement driven in such a manner is shown in Figure 5.
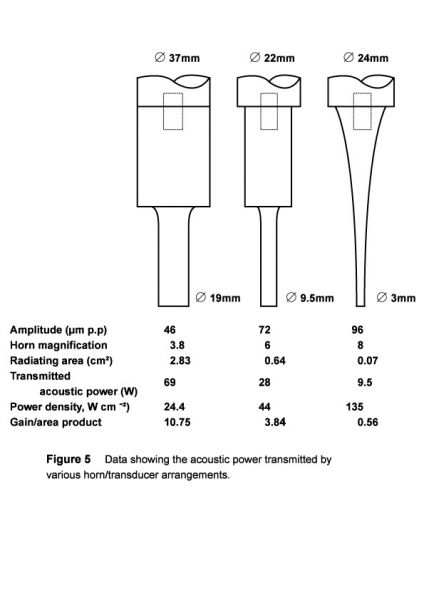
In these examples the treatment sample was tap water (80 cm-2) at room temperature. A number of different horns were screwed in turn to the same transducer and the results are as shown. (If the gain/area product ratio were made the same for each case then the transmitted acoustic power would be similar). For the examples chosen, the energy density has been varied by selecting appropriate probe end areas. It has to be pointed out, however, that some limitations do exist, e.g. if the gain/area product is made too large then the electrical control system will be unable to handle it and the system will either stall out, or the horn will exceed its dynamic fatigue limits and fracture.
In summary, we have seen that a measure of either or both amplitude and electrical power can offer a valuable means of checking the acoustic performance of the systems and of monitoring the transmitted acoustic power.
We can measure amplitude just by looking at the end of a free transducer with a microscope. A metallurgical microscope with a X15 calibrated eyepiece and a X10 objective will enable a measurement of down to 5 microns. Since most transducers will generate amplitudes of at least 10 microns and this value is magnified by the horn, quite accurate measurements can be made. The procedure is very simple: a small spot of aluminium paint is placed on the transducer and an individual metallic fleck is focussed in the graticule. On turning on the power the rapidly vibrating spot appears as a line. The amplitude of vibration, that is the peak to peak displacement, is the overall length of the line minus the spot diameter.
Having the ability to measure amplitude with a microscope is clearly impractical during a sonochemical experiment. A method is required which provides continuous monitoring with a display. There are two possible approaches; electro-mechanical and purely electrical.
The alternating stress in a resonant element is at a maximum in the centre (see Figure 2). If a strain gauge is bonded to the centre of such an element then the output from this will be proportional to the displacement or amplitude of vibration. This output signal can be rectified and displayed for example on a meter. The meter can then be calibrated by the use of a microscope (see the 'Directly by microscope' section above). It is also possible to derive a purely electrical signal that is proportional to transducer dis-placement and this possibly offers a more elegant solution since it eliminates the use of the strain gauge which can be a somewhat fragile element.
Using this method it should only be necessary to calibrate the meter once since any sub-sequent change in transducer amplitude due to loading will be accompanied by a proportional change in strain in the transducer/acoustic system. The meter will thus follow any induced changes of amplitude which may occur either as a result of power input or load variation.
Electrical methods of measurement can be contained within the ultrasonic generator. Essentially this is a power amplifier which converts energy at the mains frequency to energy at a chosen ultrasonic frequency. Because of the very narrow operating frequency band of the transducer, it is essential that the amplifier tracks any changes in resonant frequency of the system. This can be done by sensing with electrical means the transducer motion in a similar manner as that just examined.
The same electrical signal used to display amplitude can be fed back into the amplifier and this will enable the power generated to follow any frequency changes in the transducer/acoustic system. This is very important because the resonant frequency of the transducer decreases as it becomes warm and lengthens. Changes in the treatment sample can also affect the frequency. Both of these effects would be sufficient to shift the system off resonance with an accompanying performance loss were it not for the automatic tracking, normally referred to as Automatic Frequency Control (AFC).
Another desirable feature of this method is that it can be used to limit the transducer amplitude and thus ensure that it does not damage either itself or the coupled resonant elements due to overstress.
There is little doubt that cavitation does influence the chemical acceleration process and so an appreciation of the mechanism is necessary. The subject has been and continues to be covered by many workers and there is much detailed published work. Some important references considering much of the detail are given but the following gives a brief general explanation.
Cavitation may occur when applying high intensity ultrasound to liquids. In generating cavitation a sinusoidal pressure is superimposed on the steady ambient pressure.
Now all liquids contain small gas bubbles in suspension or gas entrained in colloidal solids. Their response to the alternating sound field may be violent or rather gentle, depending on pressure levels, frequency of the alternating pressure and other ambient conditions. The violent form is known as transient cavitation and the gentle form is known as stable cavitation. Stable cavities are bubbles that oscillate, often non-linearly, around some equilibrium size. They are relatively permanent and can continue to oscillate for many cycles of acoustic pressure. On the other hand, transient cavities usually exist for less than one cycle. If the acoustic pressure is great enough for the liquid to go into tension during the negative half-cycle, then the cavities will expand rapidly often to many times their original size. Following this on the positive half-cycle, they collapse violently often breaking up into many smaller bubbles. It is during this phase that the well known disruptive effects of cavitation occur.
Two aspects of cavitation that may be of interest are shown in Figures 6 and 7. Figure 6 illustrates the frequency dependence of the intensity required to produce cavitation. The example given is for degassed water at room temperature. It will be noted that the intensity required to produce vaporous cavitation above the frequency of » 100 kHz rises rapidly.
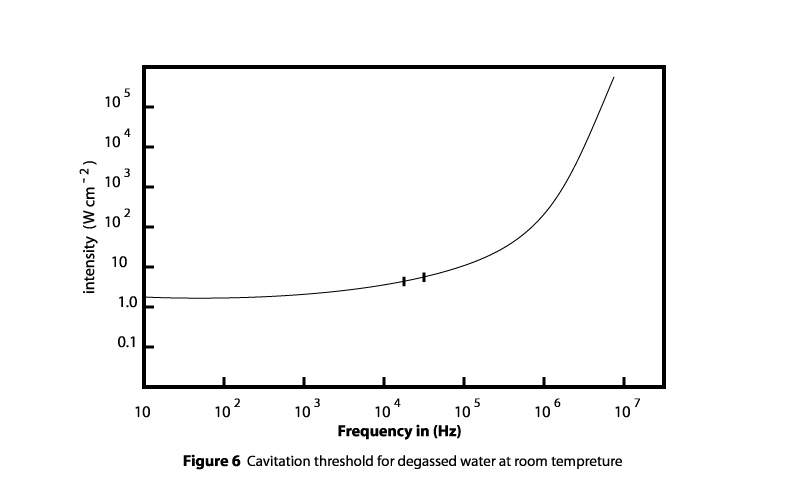
Figure 7 illustrates the effect of temperature on cavitation and its associated hysteresis effect. This example is for tap water and the increase in intensity as the temperature is increased can be observed before it falls away at the boiling point. When the temperature is allowed to fall an increase in intensity is found in the region of 50-60ºC. This is quite a significant effect and appears to occur in all liquids.

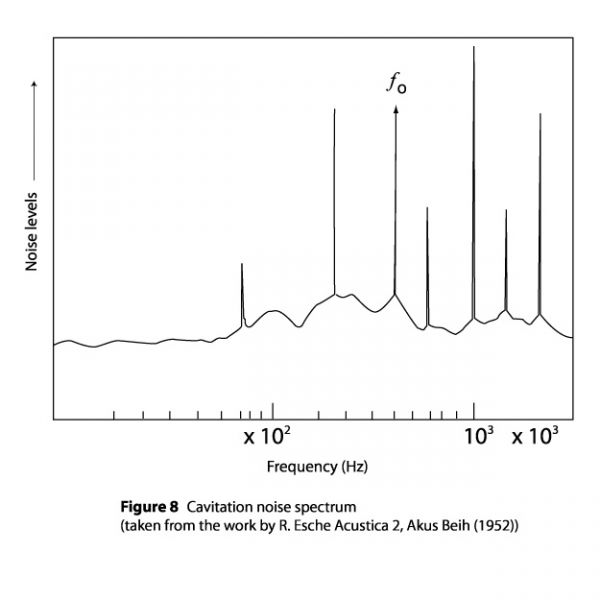
Cavitation effects, produced during the sonication of a liquid sample, results in the generation of a wide spectrum of noise. This noise is radiated into the atmosphere and consideration must therefore be given to the health and safety aspects associated with the use of ultrasound.
The frequency spectrum generated by a single source frequency ƒ0 is shown in Figure 8. Note the strong subharmonic which gives a very audible level even for a 20 kHz system. Permitted exposure limits do vary from country to country but are normally found to have a maximum of between 85 and 90 dBA over a 8 h period. Shorter exposure times permit higher pressure levels. If, for example, the exposure time is halved then the pressure limit may be doubled. This means that for a 4 h exposure, then the limit would be increased by 3 dBA, a 2 h exposure by 3 dBA and so on, up to a maximum of 120 dBA.
There are two ways of guarding against radiated noise: either acoustic earmuffs or an acoustic screen around the apparatus. The first solution would be acceptable for one isolated worker with short exposure times, although muffs can become uncomfortable if worn for long periods particularly in a warm atmosphere. The second solution would take the form of a box lined with a proprietary sound absorbing materials. The transducer and treatment sample would be housed within the box. A 6mm thick Perspex door would permit observation of the sonication process. A well fitted door is essential however since noise, like water, will escape through any gaps.
Noise levels in excess of 100 dBA would not be uncommon at a distance of 1 m when processing small samples at 20 kHz without acoustic screening. It is certainly possible to reduce these levels to 75 dBA by a well designed screening box.
In a production situation the volumes treated will be very much larger than those considered in the laboratory. Almost certainly the type of process will govern the choice of transducer energy density required and it could well be that some processes would be suited to a low intensity sonication, whereas others may need the higher intensity of the probe system.
In the case of low intensity treatment, the reacting liquids could be flowed in a controlled manner through an ultrasonic tank (see Figure 9) and out over a weir to the next process.
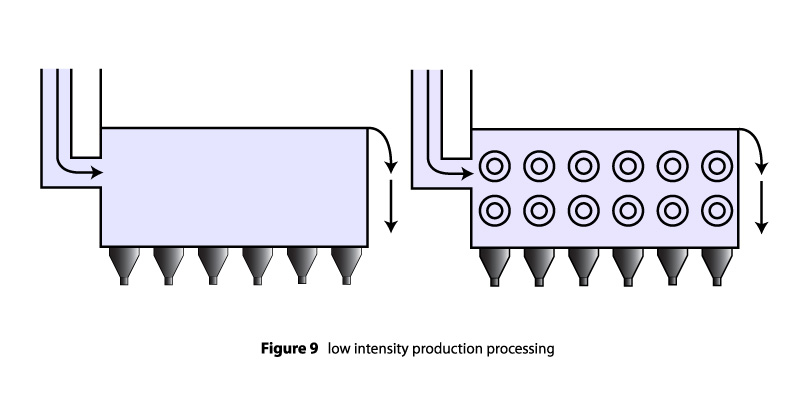
A number of such sonically activated stages could be connected in line. The tanks would be constructed in an appropriate grade of stainless steel or if plastic tanks are used then the transducer could be bonded onto a stainless or titanium plate and bolted with a gasket into the tank. Alternatively a scaled submersible transducer assembly could be employed.
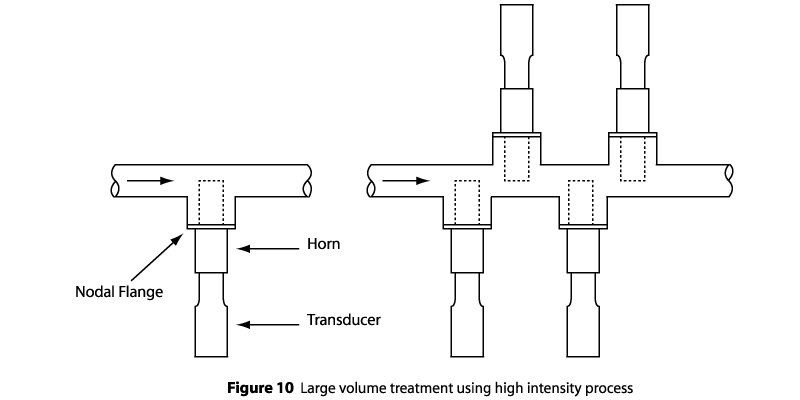
If high intensity treatment is needed it is possible to couple a probe transducer into a flow pipe by means of a 'T' section. A number of such transducers could be employed in this manner (see Figure 10). The actual number and position in the process line would need to have been determined during the process development phase.